Record your profits and losses
Create a simple profits-and-losses chart using paper or a spreadsheet, record pretend shop sales and expenses, and analyze results together.


Step-by-step guide to record your profits and losses
Profit and Loss | Part 1/3 | English | Class 7
Step 1
Pick a fun name for your pretend shop and say it out loud.
Step 2
Choose 4 to 6 items to sell and write each item on your paper.
Step 3
Next to each item write a selling price and a cost to make or buy it.
Step 4
Draw a chart with columns labeled Date; Item; Sale Price; Cost; Profit/Loss; Running Balance.
Step 5
Decide a starting cash amount and write it at the top as Cash on Hand.
Step 6
Count how many of each item you have and write the inventory numbers beside the items.
Step 7
Pretend to make five sales using play money or imaginary customers.
Step 8
For each sale write the date the item sold the sale price and the cost into your chart.
Step 9
For each recorded sale subtract the cost from the sale price and write the profit or loss in the Profit/Loss column.
Step 10
Add all sale prices to find total revenue and add all costs to find total expenses then calculate total profit or loss and write these totals at the bottom.
Step 11
Update the Running Balance by adding the total profit or loss to your starting cash and write the new balance.
Step 12
Circle the best-selling item and write one short sentence about why you think it sold well.
Step 13
Choose one item to change the price for and write the new price next to the old one.
Step 14
Pretend to make two more sales with the new price and record those sales and their profit or loss in the chart.
Step 15
Take a photo or summary of your finished chart and share your creation on DIY.org.
Help!?
What can we use if we don't have play money, a camera, or plain paper?
If you don't have play money use real coins, buttons, or drawn 'money', if you can't take a photo write a short summary of your finished chart to share on DIY.org, and if you lack plain paper use notebook pages or index cards to list items and make the chart.
What if my profit/loss or running balance calculations don't seem right?
If subtraction errors happen when you calculate Profit/Loss (sale price minus cost) or update the Running Balance, re-check each sale with a calculator, line up your Date/Item/Sale Price/Cost columns, and keep a running tally of total revenue and total expenses as you record sales.
How can I change this activity for younger or older kids?
For younger children, pick 4 simple items and use pictures, counters, and 2–3 pretend sales to fill the chart, while older kids can write 4–6 items with inventory numbers, complete the five pretend sales plus the two new-price sales, and add details like discounts or taxes.
How can we make the shop project more creative or challenging?
Create a logo and shop signs, make price tags, test two different prices for one item and compare the profits in your chart after the two new-price sales, and write a one-sentence ad for your circled best-selling item before sharing the photo or summary on DIY.org.
Watch videos on how to record your profits and losses
How to find Profit and Loss / Calculate Profit and Loss using formula / Profit and Loss
4 Videos
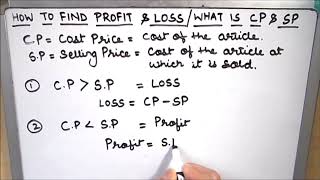
How to find Profit and Loss / Calculate Profit and Loss using formula / Profit and Loss

How To Make Profit And Loss Statement In 6 EASY STEPS

What are Income and Expenses? A Simple Explanation for Kids and Beginners
Understanding a P&L in 8 minutes (Income statement/profit & loss stmt)
Facts about financial literacy for kids
🧾 An income statement is another name for a profit-and-loss (P&L) — it shows money in, money out, and what’s left.
💰 Profit is what’s left after you pay all expenses — even a lemonade stand can teach you about profits!
📈 The first popular electronic spreadsheet, VisiCalc, came out in 1979 and changed how people track money.
🛍️ Keeping track of every sale and expense helps you spot best-sellers and items that lose money.
🧮 Practicing pretend shop bookkeeping builds real skills like budgeting, decision-making, and number sense.
How do I set up a simple profits-and-losses chart for a pretend shop with my child?
What materials do I need to record profits and losses for a kids' pretend shop?
What ages is this profits-and-losses activity suitable for?
What are the benefits of recording profits and losses with children?
