
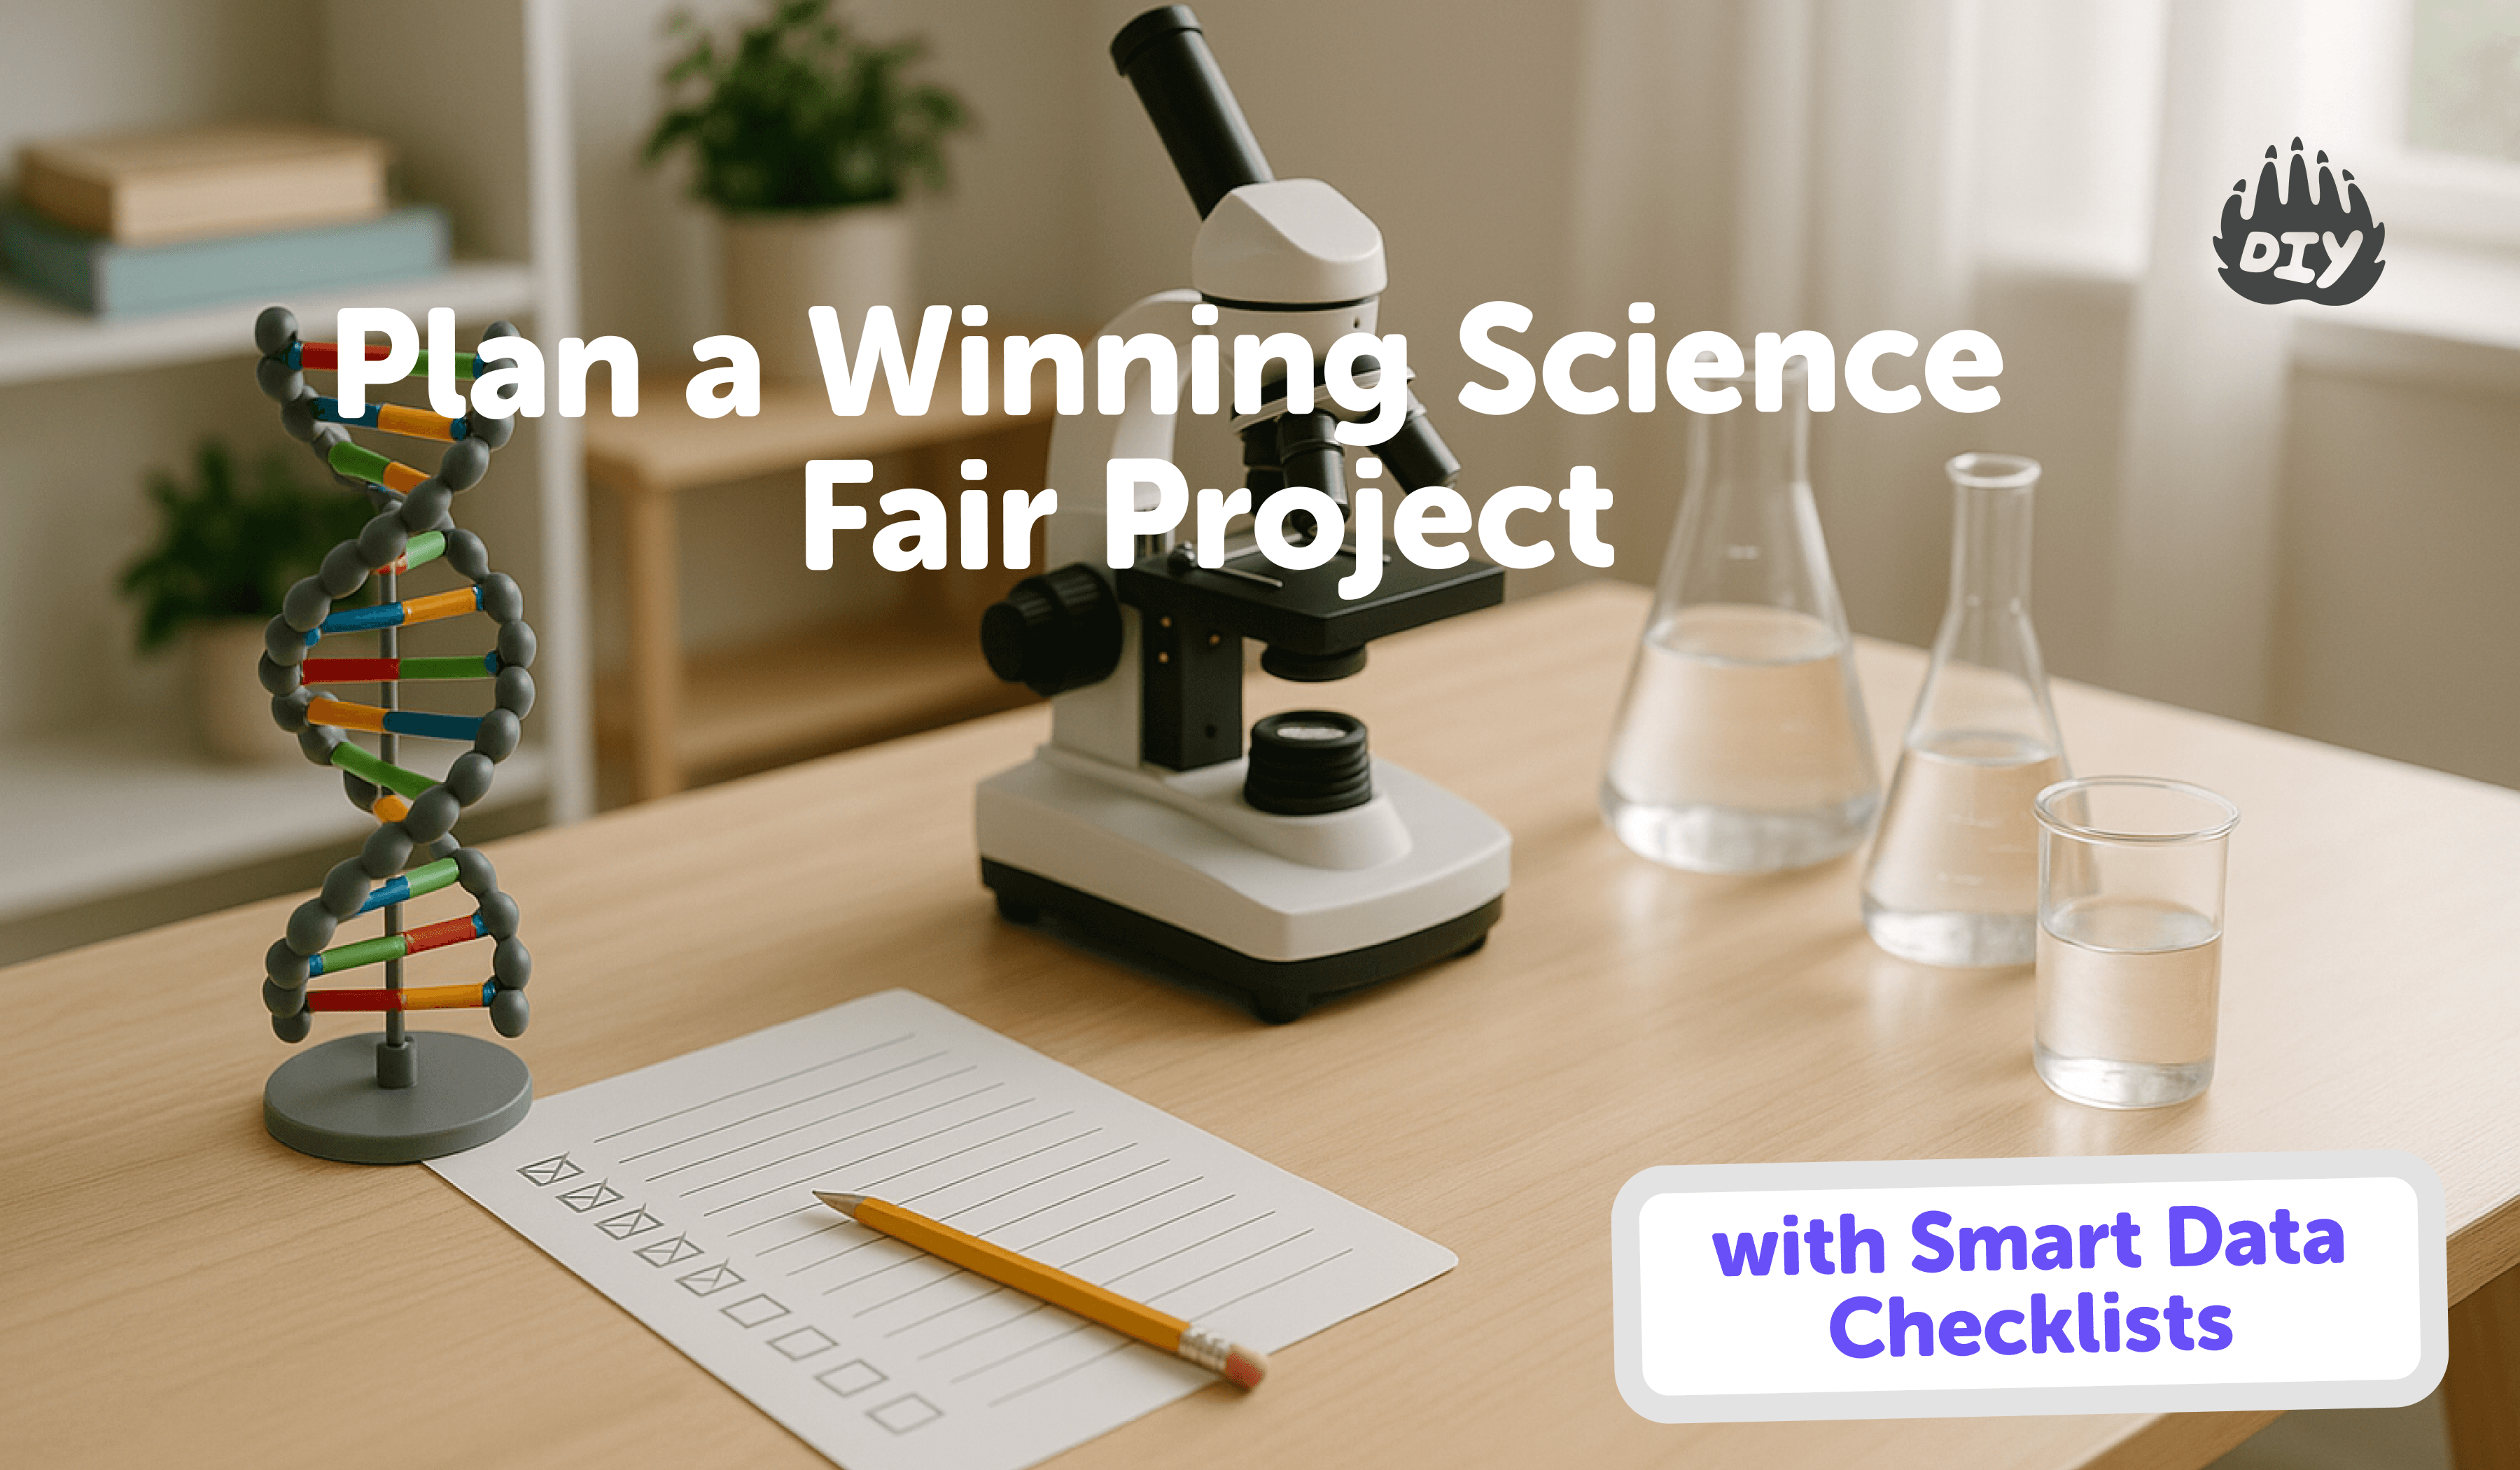
Great science fair projects are simple, fair tests with clear data. This guide walks you through the scientific method steps and gives you printable checklists so nothing gets missed: hypothesis, variables, data collection, daily logbook, graph planner, and a judge-ready board layout.
Try the AI Homework Helper for hypothesis ideas, variables tables, and data-checklist prompts.
Step 1. Start with a real question
A strong question is observable, measurable, safe, and doable in 2–4 weeks.
Try prompts like:
What changes the speed of plant growth?
Which insulator keeps a drink cold the longest?
Do different soaps kill more bacteria on hands?
Fair test rule (keep this handy): Change one variable, measure one outcome, and keep everything else the same.
Step 2. Map your project on one page
Here’s your path: Question → Research → Hypothesis → Variables → Materials → Procedure → Data → Analysis → Conclusion → Communicate. Grab the One-Page Planner above to sketch your plan in 10 minutes.
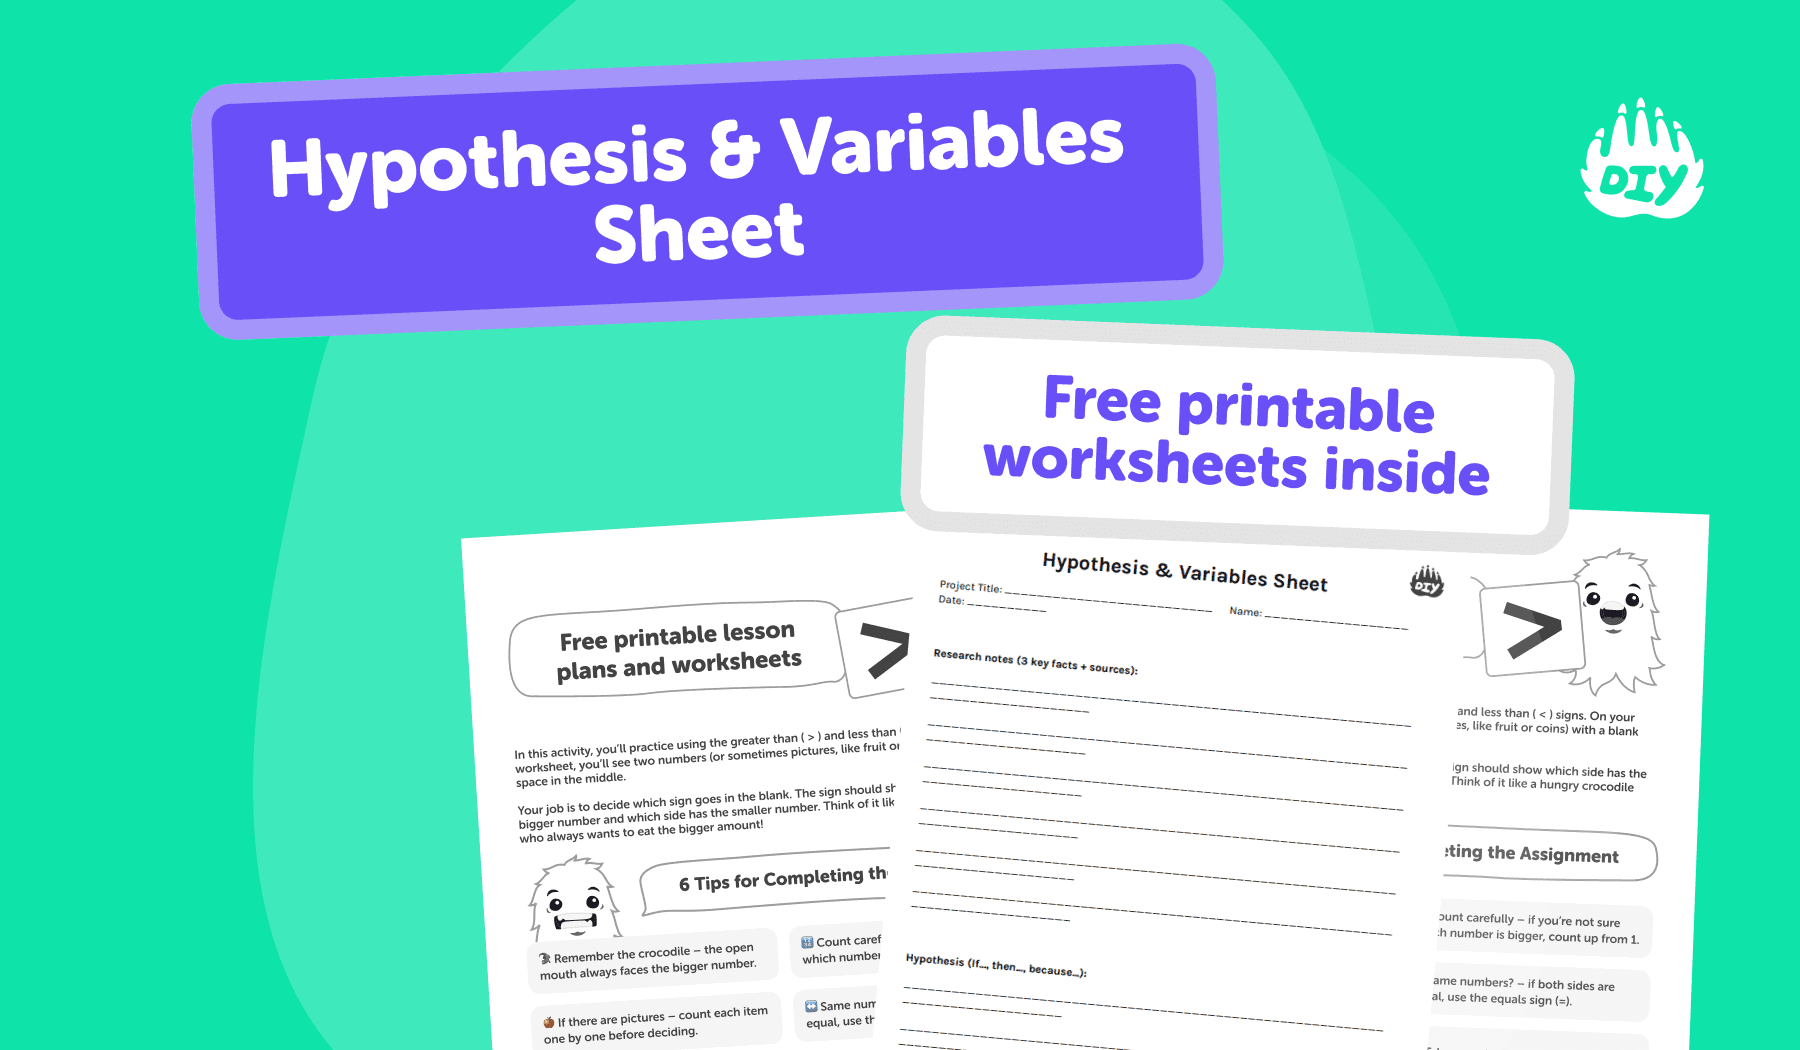
Step 3. Write a clear hypothesis and define variables
Hypothesis template: If I change [independent variable], then [dependent variable] will [increase/decrease/stay the same] because [scientific reason].
Hypothesis examples
If I increase sunlight hours, then plant height will increase because photosynthesis needs light.
If I use foam insulation, then the temperature drop will be smaller because foam reduces heat transfer.
Variables in science (quick check)
Independent: what you change (e.g., insulation type)
Dependent: what you measure (e.g., temperature drop)
Controlled: what you keep the same (cup size, start temperature, volume, room temp)
Sample size & trials: Aim for 3+ trials per condition and 15–30 total data points for clearer patterns.
Use the printable Hypothesis & Variables Sheet to lock this down.
Step 4. Build a rock-solid procedure
Materials list tips
List item, quantity, and any experiment safety rules (PPE, adult supervision, disposal).
Procedure tips
Write numbered steps you could hand to a friend and they’d get the same results.
Include time per trial, exact measurements/units, and photos of the setup.
Add a backup plan (what if a thermometer breaks?).
Safety & ethics
Use PPE when needed; get adult supervision for heat, chemicals, or cutting tools.
Avoid personal data. Follow disposal rules for food and bio projects.
Step 5. Collect reliable data (without the chaos)
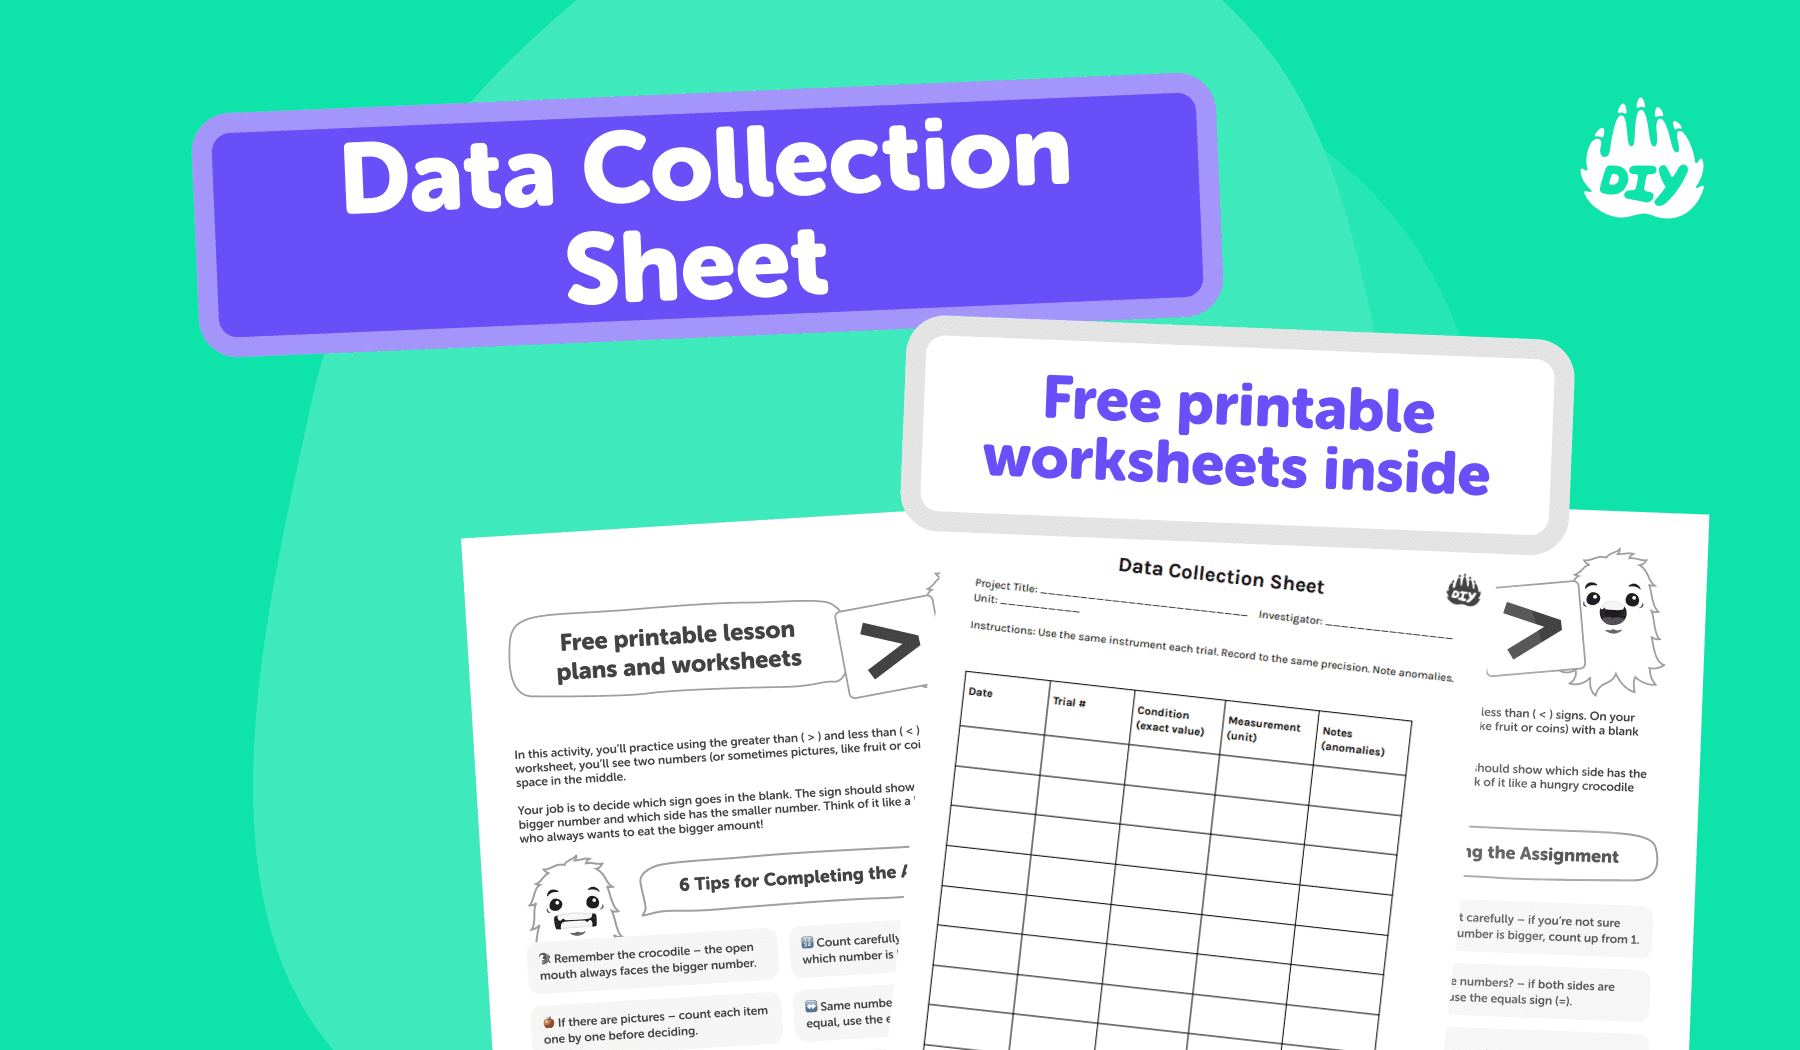
Use the Data Collection Sheet to keep data neat and consistent.
Measurement quality checklist
Same instrument each trial; calibrate or zero if needed.
Same timing method every time.
Record with the same precision (e.g., 0.1 °C).
Decide your outlier rule before you start (e.g., re-measure once; if still off, mark as outlier).
Do at least 3 trials per condition.
Keep a Science Fair Logbook (daily page included in the pack) with what you planned, what you did, changes, and problems/fixes. Judges love clean documentation.
Step 6. Turn numbers into a story (graphs + analysis)
Which graph?
Bar graph for categories (e.g., foam vs felt vs none).
Line graph for change over time (e.g., plant height each day).
Graphing data for science fair:
Title: Effect of [independent] on [dependent]
Labeled axes with units
Legend if needed
One hero graph for your board
Simple analysis script
What changed? How big was the change?
Compute averages (and percent change if helpful).
Explain why you think it happened—use your research.
Note limits (small sample size, measurement error).
Suggest one next test.
Step 7. Build a judge-ready science fair board layout
Organize your tri-fold so it’s easy to scan:
Left: Question, Background Research, Hypothesis
Middle: Materials, Procedure, 3–5 clear photos
Right: Data (hero graph), Analysis, Conclusion, Next Steps
Quick wins
Use readable headings and consistent units.
Captions under photos explaining what they show.
Prepare a 30-second summary: What I tested → What changed → What I learned.
Example you can copy: “Which cup insulation keeps drinks cold the longest?”
Section | Details |
|---|---|
Example Title | Which cup insulation keeps drinks cold the longest? |
Question | Which insulation (foam, felt, none) keeps a 200 ml drink cold the longest at room temperature? |
Variables | Independent: Insulation type (foam, felt, none) Dependent: Temperature drop over 30 minutes (°C) Controlled: Volume (200 ml), starting temperature (10 °C), cup size, room temperature, thermometer |
Procedure Snapshot | 1) Wrap cup with selected insulation (or none). 2) Pour 200 ml water at 10 °C. Start timer. 3) Measure temperature every 5 minutes for 30 minutes. 4) Repeat 3 trials per insulation. |
Data & Graph | Table: rows = minute marks (0, 5, 10, …, 30); columns = foam, felt, none (temperature °C). Graph: Line graph → x-axis = time (minutes); y-axis = temperature (°C). |
Conclusion Template | Data shows foam performed best because it reduced heat transfer. Errors: thermometer lag; room temp varied ±0.5 °C. Next: test double-layer foam and reflective foil. |
Troubleshooting: 10 common project problems
Not enough trials → Add repeats for each condition.
Inconsistent timing → Use a single timer and the same person.
Switching instruments → Stick with one measuring tool.
Vague units → Pick one unit and keep it consistent.
Sloppy labels → Label samples before testing.
Missing controls → Add a baseline condition.
Hypothesis doesn’t match data → That’s okay; explain why.
Graph mismatch → Choose a chart that fits the data type.
No notes → Use your logbook daily.
Overloading the board → One hero graph beats five busy ones.
Science fair judging criteria (what scorers look for)
Clear question and fair test
Data quality and organization
Sound analysis tied to evidence
Creativity and real-world thinking
Communication (board clarity + short verbal summary)
Map your project to the science fair rubric from your school; your checklists line up with common criteria.
Free downloads (printables)
Grab the full pack here: Download the Science Fair Data Pack (PDF)
FAQs
How many trials do I need for a science fair project?
At least 3 trials per condition. More data gives clearer patterns and stronger conclusions.
What are independent and dependent variables?
Independent is what you change. Dependent is what you measure. Controls are what you keep the same to make it a fair test.
Do I need a control group?
If you’re comparing treatments, yes. A control shows the baseline so you can see the real difference.
How do I make my science fair board stand out?
One hero graph, clean headings, and a 30-second spoken summary. Keep units consistent and captions informative.
What if my results don’t match my hypothesis?
That’s still science. Explain what happened and why you think it happened, then suggest a next step.
