Regression Analysis Facts For Kids
Regression analysis is a method used in statistics to understand how one variable affects another by looking at their relationships.

Do more with AI
Introduction
Regression analysis is like solving a mystery! 🕵️♂️ Imagine you want to find out how much sleep affects how well you do in school. Regression analysis helps you see if more sleep means better grades! 🎓It looks at one thing (the dependent variable, like grades) and how it relates to other things (independent variables, like hours of sleep). This helps scientists, teachers, and even businesses make smarter choices! 📊It’s used everywhere, so learning about it can be fun and useful in understanding the world around you! 🌍
Images of Regression Analysis

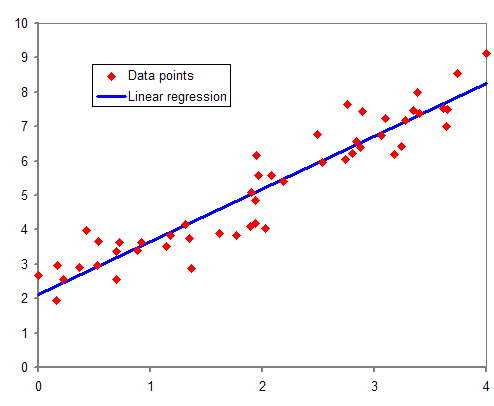
Illustration of linear regression on a data set
![In the middle, the fitted straight line represents the best balance between the points above and below this line. The dotted straight lines represent the two extreme lines, considering only the variation in the slope. The inner curves represent the estimated range of values considering the variation in both slope and intercept. The outer curves represent a prediction for a new measurement.[24]](https://upload.wikimedia.org/wikipedia/commons/thumb/c/c7/CurveWeightHeight.png/500px-CurveWeightHeight.png)
In the middle, the fitted straight line represents the best balance between the points above and below this line. The dotted straight lines represent the two extreme lines, considering only the variation in the slope. The inner curves represent the estimated range of values considering the variation in both slope and intercept. The outer curves represent a prediction for a new measurement.[24]
Illustration of linear regression on a data set
In the middle, the fitted straight line represents the best balance between the points above and below this line. The dotted straight lines represent the two extreme lines, considering only the variation in the slope. The inner curves represent the estimated range of values considering the variation in both slope and intercept. The outer curves represent a prediction for a new measurement.[24]
Types Of Regression Models
There are different types of regression models, kind of like different flavors of ice cream! 🍨The most common is linear regression, which makes a straight line. This is perfect for simple relationships, like your height growing over the years! 📏There’s also polynomial regression for curvy shapes, like how a ball bounces. 🎾Then we have multiple regression, which studies many things at once! 🏢Each type has its job, just like how every flavor makes ice cream extra special! 🍒
What Is Regression Analysis?
Regression analysis is a way to understand relationships between things. 📈For example, let’s say you want to know how the weather affects ice cream sales! 🍦You could collect data, like how hot it is (the independent variable) and how many ice cream cones are sold (the dependent variable). By using regression analysis, you can create a formula or “rule” that shows how one thing changes when another changes. Just like a magical recipe, it helps predict the future with numbers! ✨
Interpreting Regression Output
Interpreting regression output is about reading a story from numbers! 📖When you complete your analysis, you’ll find a line or curve that tells you how the variables connect. 🌈You might see something called the "slope," which shows how something changes! ⚖️ For example, if for every hour more of sleep you get, your grades go up by 5 points, that’s valuable knowledge! 🎓Lastly, look at the "R-squared" value, which shows how well your model fits. A value close to 1 means it works great! 🌟
Assumptions Of Regression Analysis
When using regression analysis, we have some assumptions to ensure it works well! 🔍First, we hope our data is random and covers all possibilities. Second, we want the relationship between the independent and dependent variables to be linear, or straight. 📏Third, we want our data points to scatter evenly, like marbles in a bag! Lastly, we assume there’s no unusual data that can disturb our findings. 🥴Like having a fair game, these rules help us understand our findings correctly! 🎲
Applications Of Regression Analysis
Regression analysis is used in many exciting places! 🎉For example, farmers use it to know how much water 🌊 their crops need to grow tall. 🥦In healthcare, doctors use it to find out how different lifestyles (like exercise 🚴♂️ and eatings habits 🍎) can affect health outcomes. Businesses analyze sales data 📊 to determine what customers enjoy the most. 📦It’s like a superhero tool that helps solve real-world problems by predicting outcomes! 🦸♂️
Comparing Different Regression Models
Comparing different regression models is like tasting different ice cream flavors! 🍦Each model has its strengths and weaknesses. For instance, linear regression is simple and easy to understand but may not fit curvy relationships well. 🌀On the other hand, polynomial regression can capture those curves but may be complex! 🏋️♂️ Comparing models helps us choose the best one for our data. It’s like picking the right flavor for your sundae! 🍨After comparing, you can say which model tells the best story about your data! 📊
Common Pitfalls In Regression Analysis
Even clever scientists make mistakes! 🤓One common pitfall is using data that isn’t accurate. 🚫If we get bad information, our predictions will also be bad! Another mistake is thinking that just because two things are related, one causes the other—like ice cream sales and hot weather! ☀️ It doesn’t mean that hot weather makes us buy ice cream; it’s just a fun coincidence! 🍦Lastly, overlooking unusual data points can lead to wrong conclusions. So, checking everything carefully is super important! 🔍
Steps In Performing Regression Analysis
Doing regression analysis is like following a recipe! 📜First, gather your data, like how much you sleep and your grades. 📚Next, clean the data to make sure nothing is wrong. 🧹After that, pick the right regression method, like linear regression for simple relations! Then, run your analysis using a computer program. 💻Finally, interpret the results, like understanding what they teach you about sleep and grades, and see if it's a good recipe! 🍰
Real-world Examples Of Regression Analysis
Let’s look at some real-world examples of regression analysis! 🌍Scientists study climate change 🌡️ using regression to see how much carbon dioxide affects temperatures. 🥵In sports, teams analyze player data to predict scores during games. ⚽Businesses may analyze customer behavior to predict how changes will affect sales. 📈All these examples show how important regression analysis is in making predictions and helping people make decisions. It’s like a crystal ball but with numbers! 🔮
Conclusion And Future Trends In Regression Analysis
In conclusion, regression analysis is a super handy tool that helps us understand relationships between different things! 🎊As technology grows, we’ll see even more exciting ways to use regression, like in robotics 🤖 and artificial intelligence! ✨We might discover new relationships or even create new models to solve different puzzles! 🧩It makes learning so cool and shows how much we can affect the world with data. So keep exploring and asking questions, and who knows what exciting discoveries await you? 🚀
Regression Analysis Quiz
Learn more about Regression Analysis
