Statistics Facts For Kids
Statistics is the discipline that concerns the collection, organization, analysis, interpretation, and presentation of data.


Do more with AI
Introduction
Statistics is like a magical toolbox that helps us understand the world around us! 🔍It teaches us how to gather and use information, also known as data. We can find data everywhere! For example, if we want to know how many kids in class like pizza 🍕, we can ask everyone and count their answers. Statistics makes it easier to see patterns and trends, like if most friends prefer chocolate or vanilla ice cream 🍦. By learning statistics, we become super detectives of information, uncovering exciting secrets in numbers! 📊
Images of Statistics

Scatter plots and line charts are used in descriptive statistics to show the observed relationships between different variables, here using the Iris flower data set.

A least squares fit: in red the points to be fitted, in blue the fitted line.

Confidence intervals: the red line is true value for the mean in this example, the blue lines are random confidence intervals for 100 realizations.

In this graph the black line is probability distribution for the test statistic, the critical region is the set of values to the right of the observed data point (observed value of the test statistic) and the p-value is represented by the green area.

Bernoulli's Ars Conjectandi was the first work that dealt with probability theory as currently understood.

Carl Friedrich Gauss made major contributions to probabilistic methods leading to statistics.

Karl Pearson, a founder of mathematical statistics

gretl, an example of an open source statistical package
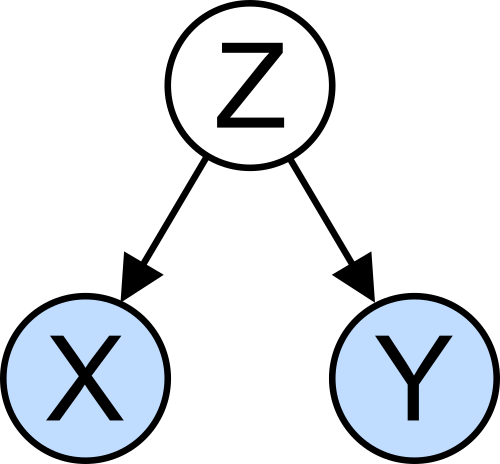
The confounding variable problem: X and Y may be correlated, not because there is causal relationship between them, but because both depend on a third variable Z. Z is called a confounding factor.
Scatter plots and line charts are used in descriptive statistics to show the observed relationships between different variables, here using the Iris flower data set.
A least squares fit: in red the points to be fitted, in blue the fitted line.
Confidence intervals: the red line is true value for the mean in this example, the blue lines are random confidence intervals for 100 realizations.
In this graph the black line is probability distribution for the test statistic, the critical region is the set of values to the right of the observed data point (observed value of the test statistic) and the p-value is represented by the green area.
Bernoulli's Ars Conjectandi was the first work that dealt with probability theory as currently understood.
Carl Friedrich Gauss made major contributions to probabilistic methods leading to statistics.
Karl Pearson, a founder of mathematical statistics
gretl, an example of an open source statistical package
The confounding variable problem: X and Y may be correlated, not because there is causal relationship between them, but because both depend on a third variable Z. Z is called a confounding factor.
Types Of Data
Data comes in many forms! 📊The two main types are qualitative and quantitative. Qualitative data is all about descriptions. For example, colors like red 🍎, blue 💙, or feelings like happy 🤗 and sad 😢. Quantitative data, on the other hand, focuses on numbers! For instance, counting how many apples you have 🍏 or how tall you are in centimeters. 🥇If we mix both types, we can learn a lot! Knowing how many kids like certain stickers 😊 and what colors they are helps us find fun trends and preferences!
Hypothesis Testing
Hypothesis testing is like being a detective! 🕵️♂️ We create a hypothesis, or a guess, about something we think is true, and then we test it! For example, if we think that kids who drink milk grow taller than those who don’t, we can measure their heights and compare. 📏After collecting data, we see if our hypothesis is supported or not. We use confidence levels to decide how confident we are in our findings. If our evidence is strong enough, we say the hypothesis is true. If not, we say it’s false. It helps us answer questions scientifically!
Probability Theory
Probability theory helps us understand chances and risks! 🎲It's all about figuring out how likely something is to happen. For example, if we flip a coin, there are two possible outcomes: heads or tails. 🪙Each side has a 50% chance of coming up! Probability teaches us to think about events as outcomes, from rolling dice to predicting weather. 🌦️ We use fractions, percentages, and ratios to express probabilities. The more we know about probability, the better we become at making predictions about everyday situations, like weather forecasts and game scores! 📈
Statistical Software
Statistical software is like a superhero sidekick for statisticians! 🦸♂️ These are computer programs that help us analyze and visualize data quickly. Some popular software includes Excel, R, and SPSS. In Excel, we can create charts and graphs, while R allows us to perform complex calculations easily. 📈These tools save time and allow us to check our findings accurately! Whenever we have a lot of data, software helps us make sense of it all. Learning to use statistical software can be super fun and opens doors for exploring numbers like a pro! 🖥️
History Of Statistics
The story of statistics goes back a long time! The word "statistics" comes from the Latin word "status," which means "state." 🌍 In the 17th century, people began using statistics to count soldiers and gather information about their countries. One famous statistician, John Graunt, studied death records in London in the 1600s! ⚰️ This helped people understand health better. Later, in the 18th century, mathematicians like Pierre-Simon Laplace used statistics to help with science and astronomy. 🪐Today, statistics is used for everything, from sports to medicine! ⚽️
Descriptive Statistics
Descriptive statistics helps us describe and summarize our data. 📊It uses numbers to show what we found. Some important measures are the mean, median, and mode. The mean is the average, which we find by adding all numbers together and dividing by how many there are. The median is the middle value when we arrange numbers in order, and the mode is the number that appears the most! 🎉For example, if we have ages like 8, 10, 8, and 9, the mean is 8.75, the median is 8.5, and the mode is 8. These tools let us understand our data better!
Inferential Statistics
Inferential statistics takes our data and helps us make guesses about larger groups! 🌍For example, if we survey 50 kids in one school, we can use that information to make guesses about all kids in the city! We use something called "sampling" to take a smaller group and see how they represent everyone else. Statistical tests, like t-tests, help us check if our guesses are correct. 🤔This type of statistics is essential when we want to understand big populations without asking everyone. It allows us to predict and make informed decisions based on what we discover!
Data Collection Methods
There are several ways to collect data! 📋One common method is surveys, where we ask questions to learn about people's opinions. For example, if we want to know which game is the favorite among our friends, we can create a simple questionnaire. 🔍Another method is experiments, where we test something and watch what happens – like baking cookies 🍪 and seeing which recipe is the tastiest. Observations also help us gather data, such as watching birds or counting cars on the road 🚗. Each method gives us special insights into the world around us!
Applications Of Statistics
Statistics is used everywhere! 📚From businesses deciding how to advertise to scientists researching health, statistics helps in numerous fields. In sports, teams analyze player performances to make better choices during games. ⚾️ In medicine, doctors use statistics to understand treatments and patient outcomes. 👩⚕️ Schools even use statistics to improve learning by evaluating test scores. The fun part is you can apply stats in your life too! Want to track your grades or compare your basketball scores with friends? Statistics can help you stay organized and informed about your interests! 🌟
Common Misinterpretations Of Data
Sometimes, people can misunderstand statistics! 🤔One common mistake is confusing correlation with causation. Just because two things happen at the same time, like ice cream sales and swimming 🏊, doesn't mean one causes the other! Another issue is using small sample sizes that don’t represent the whole group. For example, polling only ten kids to find out what everyone thinks can lead to wrong conclusions! 🚫It's also essential to remember that data can be manipulated to tell different stories. Asking questions and checking the methods used helps us get the real truth! 📊📢
Statistics Quiz
Learn more about Statistics
