Make an infographic
Design and create a colorful infographic using paper, markers, stickers, and basic data charts to explain a topic clearly and creatively.


Step-by-step guide to make an infographic
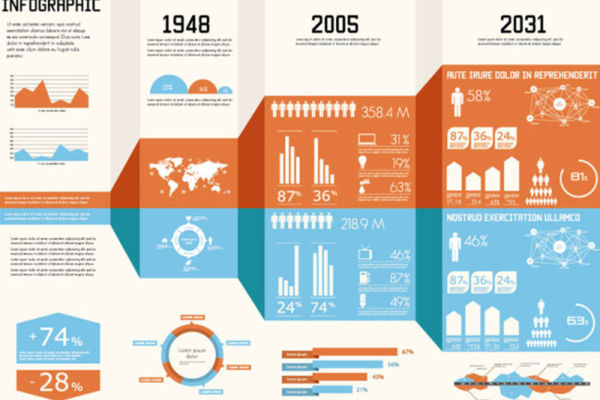
How to Make an Infographic in 5 Steps [INFOGRAPHIC DESIGN GUIDE + EXAMPLES]
Step 1
Pick a topic you care about and decide the main message you want people to learn.
Step 2
Find 3 to 6 facts or numbers about your topic from a book poster or by asking an adult.
Step 3
Choose whether you want the page to be portrait or landscape.
Step 4
Pick two or three main colors to use on your infographic.
Step 5
Lightly draw a simple layout with your pencil and ruler marking a spot for the title three fact boxes and a chart.
Step 6
Write a big clear title in pencil at the top of the page.
Step 7
Trace over and color the title with your colouring materials to make it stand out.
Step 8
Write short headings for each fact box in pencil beneath the title.
Step 9
Pick a chart type for your data either a bar chart or a pictograph made with stickers.
Step 10
Draw the chart frame with your ruler and pencil inside the chart box.
Step 11
Add bars to the frame or place sticker groups to show each data point from your facts.
Step 12
Color any bars or add colored accents to sticker groups with your colouring materials.
Step 13
Label the chart with short words or numbers using a marker so everyone can understand it.
Step 14
Decorate the rest of the infographic with stickers small drawings and little icons to make it friendly.
Step 15
Share your finished infographic on DIY.org.
Help!?
What can we use instead of stickers or a ruler if we don't have them?
If you don’t have stickers for the pictograph, use small cut-out paper shapes, coins, or drawn symbols for the 'place sticker groups' step, and substitute a straight book edge or the long side of a notebook for the ruler when you 'lightly draw a simple layout with your pencil and ruler.'
My chart bars look uneven or messy—how can we fix them?
If your bars are uneven, redraw the chart frame with your ruler and pencil, mark equal intervals for each bar before you 'Add bars to the frame,' erase any stray lines, then finalize and label with your marker.
How can we change the activity for younger or older kids?
For younger children (4–6) simplify to 1–2 facts, use large stickers and have an adult lightly draw the layout and chart frame with the ruler and pencil, while older kids can use 3–6 facts, add a legend, exact number labels with a marker, or create the infographic digitally to share on DIY.org.
How can we make the infographic more special or advanced?
To enhance the infographic, add a small 'source' box listing the book or adult you asked, glue real objects inside the chart frame for a tactile pictograph, or include a QR code that links to more information before sharing on DIY.org.
Watch videos on how to make an infographic
How To Create Infographics (The Ultra-Simple & Easy Way)
4 Videos
How To Create Infographics (The Ultra-Simple & Easy Way)

How to Create an Infographic using Canva

Create easy INFOGRAPHICS with Canva
How To Use Canva To Create Infographics - Step-by-Step Guide
Facts about infographics and data visualization
🧠 Brains process images faster than words—pictures can be recognized in a fraction of a second!
📊 The first modern pie chart was published by William Playfair in 1801, helping people see numbers at a glance.
🎨 With just three primary pigment colors (red, yellow, blue) you can mix lots of new shades for your infographic.
✂️ Stickers, cut-outs, and textures make infographics tactile and more memorable for viewers.
🔢 Simple charts like bar and pie charts let people compare numbers quickly without lots of text.
How do I make a kid-friendly infographic step by step?
What materials do I need to create a paper infographic with kids?
What ages is this infographic activity suitable for?
What are the benefits of making infographics with children?
