Make a weather map
Make a weather map using symbols, colored markers, thermometer readings, and wind observations to record temperature, wind direction, and cloud cover for learning about forecasting.

Step-by-step guide to make a weather map
Weather Patterns for Kids: Learning about the Weather |Air mass, Cold front, Thunderstorm, Tornado
Step 1
Gather all your materials and place them on a table.
Step 2
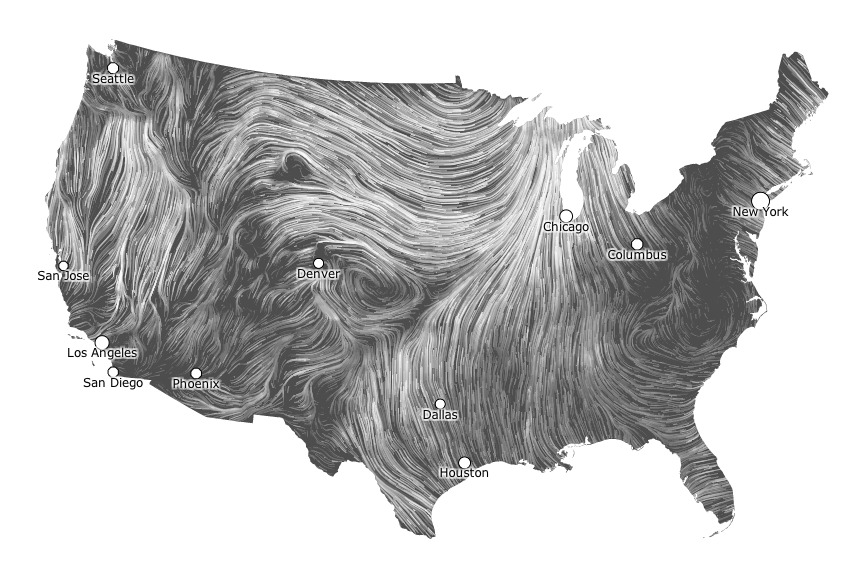
Use the pencil and ruler to draw a simple map outline of your home and nearby area or your backyard.
Step 3
Choose three observation spots like the front yard backyard and near a tree and mark them on the map as A B and C.
Step 4
Create a legend on one corner of the map with symbols for sun cloud and rain a wind arrow and a color scale for temperature.
Step 5
Make a wind indicator by taping the ribbon to the end of a pencil or stick.
Step 6
Walk to spot A carrying the thermometer and your wind indicator.
Step 7
Hold the thermometer at spot A for one minute then write the temperature number next to A on your map.
Step 8
Hold up your ribbon at spot A watch which way it blows then draw an arrow on the map to show that wind direction.
Step 9
Look at the sky from spot A decide the cloud cover and draw the matching cloud symbol next to A.
Step 10
Repeat Steps 6 to 9 at spots B and C.
Step 11
Color the temperature numbers on your map using the color scale in your legend.
Step 12
Write one short sentence on your map predicting tomorrow’s weather based on the patterns you found.
Step 13
Share your finished weather map on DIY.org
Help!?
If I don't have a thermometer or ribbon for the wind indicator, what can I use instead?
Use a clean digital meat thermometer or a smartphone weather app to log temperature for Steps 6–9, and swap the ribbon for a lightweight plastic bag strip or some yarn taped to the end of the pencil or stick for the wind indicator.
The ribbon won't move or my thermometer gives wobbly numbers—how can I fix that?
Untwist or replace the ribbon so it can float freely from the pencil tip, hold the wind indicator up away from your body, and keep the thermometer still and shaded for the full one minute at each spot as described in Steps 6 and 7 to get clear wind and temperature readings.
How can I adapt this map activity for younger kids or older kids?
For younger children, simplify the map outline and use only one or two observation spots with an adult reading and recording Step 6 temperatures, while older kids can add more spots, use a compass for wind direction, and repeat Steps 6–9 several times to analyze patterns.
What are some ways to extend or personalize our finished weather map?
Extend the project by repeating Steps 6–9 on multiple days and color-coding each day's temperatures in the legend, attach photos of spots A, B, and C, and compare your one-sentence forecast to the local forecast before sharing on DIY.org.
Watch videos on how to make a weather map
Weather for Kids | What is weather, and how does it work?
4 Videos
Weather for Kids | What is weather, and how does it work?
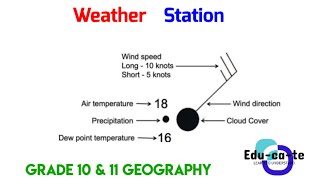
Synoptic Weather Maps - The Weather Station Model
Weather Tools for Kids | Learn How Meteorologists Measure Weather!
DIY Barometer - Weather Science and STEM Project for Kids
Facts about weather and forecasting
🌦️ Weather maps use easy symbols—suns, clouds, rain drops, and arrows—so you can see a whole region’s weather at a glance.
🌡️ Thermometers let meteorologists record temperatures to the nearest tenth; small changes can mean big weather shifts!
🌬️ Wind direction is named for where it comes from — a northerly wind blows from the north toward the south.
☁️ Cloud cover is measured in 'oktas' (eighths of the sky): 0 oktas = clear, 8 oktas = totally overcast.
🗺️ A station model can show temperature, pressure, wind, cloud, and precipitation all in a tiny symbol about the size of a postage stamp.
How do I make a weather map to learn forecasting?
What materials do I need to make a weather map with symbols and readings?
What ages is a weather map activity suitable for?
What are the benefits of making a weather map with kids?
