Econometrics Facts For Kids
Econometrics is an application of statistical methods to economic data in order to give empirical content to economic relationships.

Do more with AI
Introduction
Econometrics is a big word that helps us understand money and resources using math 📊✨! Imagine you want to know how a toy store can sell more toys. Econometrics uses numbers and data to find out what makes people buy toys 🎁. It helps businesses and governments make smart choices by studying numbers and trends. For example, it can show how high prices might change what people decide to buy. By understanding these patterns, we can help improve our world one number at a time! 🌎💡
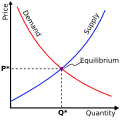
Images of Econometrics

Okun's law representing the relationship between GDP growth and the unemployment rate. The fitted line is found using regression analysis.
History Of Econometrics
Econometrics started a long time ago, in the early 20th century 🕰️. The first big ideas came from smart people like Ragnar Frisch and Jan Tinbergen, who won the Nobel Prize in 1969 for their important work in this field 🏆. They thought it was important to connect math and economics! Over the years, other talented mathematicians joined in, helping to build this cool science. By looking at things like prices, incomes, and jobs, econometrics helped us understand why people buy things and how the economy works!💰📈
Challenges And Limitations
Sometimes, econometrics can be tricky! 😕It relies on data that might not always be perfect. For example, if people don't answer survey questions honestly, the results could be misleading. Also, there are many factors affecting the economy, making it hard to pinpoint one cause💥❓. Economists must carefully choose the right methods to ensure their conclusions are accurate. And remember, while econometrics helps us understand the past and present, predicting the future can be like guessing! 🎲🔮
Applications Of Econometrics
Econometrics helps in many areas of life! 🏥📈 For example, it helps businesses decide how much to charge for their products. It can also help governments allocate resources like schools and hospitals 🏫💉. When there's a new law, econometrics can study how it affects people, like whether a tax change really helps families. Econometrics is also used in sports to understand player performance! ⚽🏆 So, it's like a special lens that helps us see how everything connects in our economy and daily life! 🌟💼
Key Concepts And Terminology
When learning econometrics, you’ll find some big words. One important term is "regression," which is a way to see how different things are related 📉🤝. For example, it can show how changes in prices affect the number of toys sold. "Variables" are things we study, like "money" or "time," and they can change. Another word is "data," which means information collected from different sources. Understanding these key concepts helps us make sense of how economies grow and change! 📊🎓
Methodologies In Econometrics
Methodologies are the ways economists study data 📜🧮. One common method is "time series analysis," where we look at data over time, like how prices change each year 🌅. Another is "cross-sectional analysis," which examines data from many places at once, like comparing toy sales in different cities 🏙️. Economists use special tools and formulas to find patterns. They also make graphs and charts to share what they find! Using these different methods helps them understand the economy better and make predictions about the future! 🔮✨
Recent Developments And Trends
Econometrics is always changing! 🔄📊 Recently, technology has made it easier to collect data faster and better. Things like computers and smartphones help economists analyze huge amounts of information🖥️📱! New tools like machine learning are helping predict economic trends more accurately. Additionally, researchers are using econometrics to study climate change and its economic effects 🌍☁️! Understanding these trends is essential for creating a sustainable future. As technology grows, so does the power of econometrics! 🚀💡
Important Figures In Econometrics
Many talented people have contributed to econometrics! 🌟Two of the most famous are Ragnar Frisch and Jan Tinbergen. They were the first to win a Nobel Prize for their work in this field! 📜Another big name is Paul Samuelson, who helped combine economics with math. More recently, researchers like Angrist and Krueger have explored new methods, like using natural experiments to study education effects 🎓. These important figures have paved the way for a better understanding of how economics works today! ✨👩🏫
Software And Tools In Econometrics
Economists nowadays have amazing tools to help them with econometrics! 🛠️💻 For example, software like R and Stata lets them analyze data easily. These programs make it possible to create graphs and run complex calculations. There's also Excel, where you can organize information and help make predictions 📈📊. Many researchers use these tools to gather information and make sense of numbers. With the right software, economists can uncover valuable insights to improve markets and economies everywhere! 🌍🔍
Case Studies Of Econometric Analysis
Here are some fun examples of econometric studies! 🎉In one case, economists studied how raising the minimum wage affected people’s spending habits 💵📈. Another case looked at how weather affected crop production, helping farmers plan better 🌾☀️. Researchers also analyzed how interest rates influence home buying and mortgages 🏡🔑. By looking at real-life examples, econometrics helps us understand how different factors interact! These studies show us the power of data in making important decisions for our future! 🌟📚
Econometrics Quiz
Learn more about Econometrics
